Overview
The following reports are available to iPipeline Carrier PHS customers in InsureSight.
Dashboard Features
Use the tabs at the bottom of the screen to quickly move between different dashboards and reports
Filters
Filters can be applied to drill down into the data and better analyze specific data metrics.
Once a filter is selected, it will immediately take effect and dynamically update the report or dashboard. Also applied filters will remain in effect until the Reset button is selected.
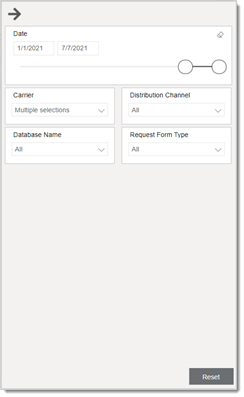
Available filters include the following:
- Date Range
- Carrier
- Distributor Channel
- Product
- State
- Signature Method
- e-Signature Status
- App Type
- Agent
- Proposed Insured
- Database Name
- GAID
Interactive visuals
1. Tooltip: Right-click a visual and be provided with additional options
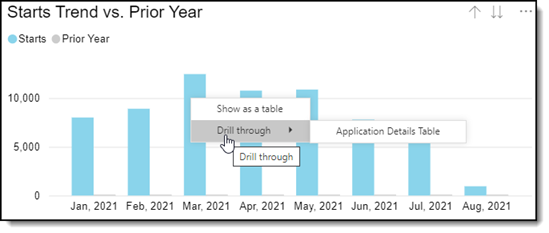
- Show as a table – This option displays the selected data as a table
- Drill Through – Use this option to view the data included behind a specific metric on the Application Details Table
2. More Options
When hovering over a visual, new options display in the top right corner.

- Use the arrows to drill up and down through different hierarchy.
- Export data (see below)
- Show as a table (see above)
- Sort by
- Sort by is determined by the data displayed in the visual
Export
The data from each visual can be exported into an excel or .csv file.
To export:
- Hover over the desired visual
- Click the “…” in the top right corner of the visual
- Select Export data
A new screen will appear

- Choose which data to import
- Choose the file format
- Click Export
Help Overlay
Each dashboard or report has a help overlay which provide an overview of the dashboard/report, any necessary data definitions, as well as information for exporting the data
To view a Help Overlay:
1. Click the question mark icon on the right side of the dashboard/report.
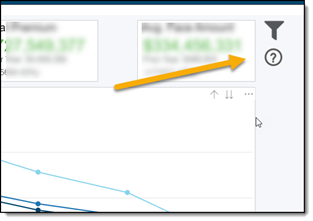
Below is an example of a help overlay:

Reports
Activity by Carrier
The Activity by Carrier report displays a summary of activity by carrier and distribution channel. The top row displays the total across all carriers.
This report includes the following fields:
- Carrier
- Distribution Channel
- Total number of applications started
- Total number of applications submitted
- Total number of wizards complete
- Total number of wizards not complete
- Total number of ID check Starts
- Total number of ID Check Fails
Request Form Type Report
The Request Form Type report displays details for each request form type. Top row displays the total number of started and submitted applications, wizards completed and not completed, and ID check stars and fails for all request form types.
This report includes the following fields:
- Request Form Types
- Total number of applications submitted
- Total number of applications submitted
- Total number of wizards complete
- Total number of Wizards not complete
- Total number of ID check starts
- Total number of ID check fails
Submission Report
The Submission report displays all submission details for Policy Holder Services products.
The report includes the following fields:
- Carrier
- Distribution Channel
- Product Type
- Policy Number
- Application Start Date
- Proposed Insured Name
- Application Submit Date
- Owner Name
- Request Form Type
- ID Check Start
- ID Check Fail
- Submission Name
- Submission Status
- Transmission Status
- Transmission Reference GUID
Standard Detail Report
The Standard Detail Report displays details, per client ID, for all Policy Holder Services products, including policy number, proposed Insured, owner, and request form type.
The report includes the following fields:
- Client ID
- Distribution Channel
- Policy Number
- Proposed Insured Name
- Owner Name
- State
- Product Type
- Request Form Type
- Application Start Date
- Application Lock Date
- Signature Method
- e-Signature Status
- e-Signature Start Date
- e-Signature Complete Date
- Application Submit Date
- Wizard Completed
- ID Check Start
- ID Check Fail
- Submission Status
- Transmission Status
Last Screen Visited Report
The Last Screen Visited Report displays the last screen visit and request form type, along with the number of applications started, but not submitted. The top row of this report displays the total number of applications that were started, but no submitted for all screens.
The report includes the following fields:
- Last Screen Visited
- Request Form type
- Total number of applications started but not submitted
This content is restricted to registered users. iPipeline customers can login or register below. Please allow up to 24 hours for your account to be approved.